
Daye’s Quarterly Theory
First, the fundamental concept is that all units of time can be divided by four into quarters — just as we look at the year’s corporate reporting cycle of Q1, Q2, Q3, and Q4.
Dividing the day by four, into six hour quarters and again into 90 minute quarters and again into 22.5 minute ‘Micro’ quarters we reach the smallest unit shown by this indicator. Apply it to your NQ1! or ES1! charts and you may see remarkable confluence with the ICT macro times!
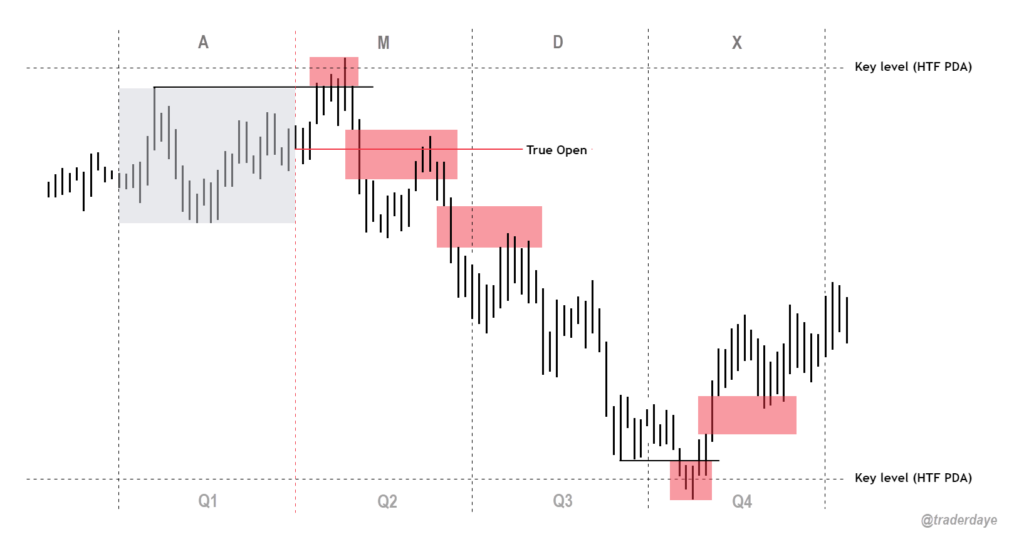
Why would we want to do this? It helps us understand, visualize and predict ICT’s PO3 concept:
• A – Accumulation (required for a cycle to occur)
• M – Manipulation
• D – Distribution
• X – Reversal/Continuation
Did ICT invent accumulation, manipulation and distribution? No, but his branding and teaching of price action is second to none, so we’ll roll with it.
The bottom line – we want to sell after a manipulation (M) up, or buy after a manipulation down and Quarterly Theory plots times on your chart where this may occur. Every asset is different, so back-test and research!
Note, this indicator always shows Q1 as the accumulation quarter (by color), but the order is not fixed and instead of AMDX may appear as XAMD, where Q1 is the Reversal/Continuation quarter. We may eventually offer an update to this indicator which would automatically transpose the quarter colors for you.
To learn about the true opens, @traderdaye on Twitter is a good place to go and @a1tmaniac’s indicator does a great job of plotting it.
The Quarters
Yearly:
• Q1 – Jan, Feb, Mar
• Q2 – Apr, May, Jun
• Q3 – Jul, Aug, Sep
• Q4 – Oct, Nov, Dec
Monthly (starts with the first month’s Monday regardless of the date):
• Q1 – Week 1, first Monday of the month
• Q2 – Week 2, second Monday of the month
• Q3 – Week 3, third Monday of the month
• Q4 – Week 4, fourth Monday of the month
Weekly (Daye ignores Friday and Sunday’s price action):
• Q1 – Mon
• Q2 – Tue
• Q3 – Wed
• Q4 – Thu
Daily (times are all EST / New York):
• Q1 – 18:00 – 00:00 Asia
• Q2 – 00:00 – 06:00 London
• Q3 – 06:00 – 12:00 NY AM
• Q4 – 12:00 – 18:00 NY PM
90 Minute:
• Q1 – 18:00 – 19:30
• Q2 – 19:30 – 21:00
• Q3 – 21:00 – 22:30
• Q4 – 22:30 – 00:00
Micro (22.5 minute quarters)
• Q1 – 18:00 – 18:22:30
• Q2 – 18:22:30 – 18:45
• Q3 – 18:45 – 19:07:30
• Q4 – 19:07:30 – 19:30
About the DQT Indicator
This indicator plots the quarterly time boxes in a panel which can be placed above or below your chart. It allows you to add labels with the opening time and dates and also place time of day markers which can be useful for anyone who wants to mark lunch, and of the trading day or perhaps a favorite ICT macro time. It also works on GOLD (CAPITALCOM), DXY (TVC), currencies and stocks in Regular Trading Hour (RTH) mode.
Note the way that the indicator displays quarters is affected by the time frame you are viewing and as a result you may notice imperfections. Also, the indicator is not tuned to work with every broker, so for example with DXY, you will see the TVC feed is displayed nicely but other feeds are not.
Settings: The DQT indicator offers a great deal of flexibility to customize the display of quarters aesthetically. But, it’s designed to work out-of-the-box on both light and dark background charts. It is set up, to only show 90 minute and micro quarters initially, but in the settings, you can turn on the daily, weekly, monthly, and yearly.
Finally, the DQT indicator works very well with our DOB indicator allowing you to visualize the confluence of high timeframe PDAs or POIs with manipulation quarters.
If you find our indicators useful, please boost, comment and share — it’s very motivational for us to develop them further and publish new ones! For more information about Quarterly Theory, Daye’s tweets and execution videos are excellent.
All content, tools, scripts, articles, & education provided by LiquidityPro are purely for informational & educational purposes only. Past performance does not guarantee future results.
2 Responses
how can i buy this indicator?
We don’t sell anything – for now everything is free.