01 / Price & structure
Displacement Order Blocks
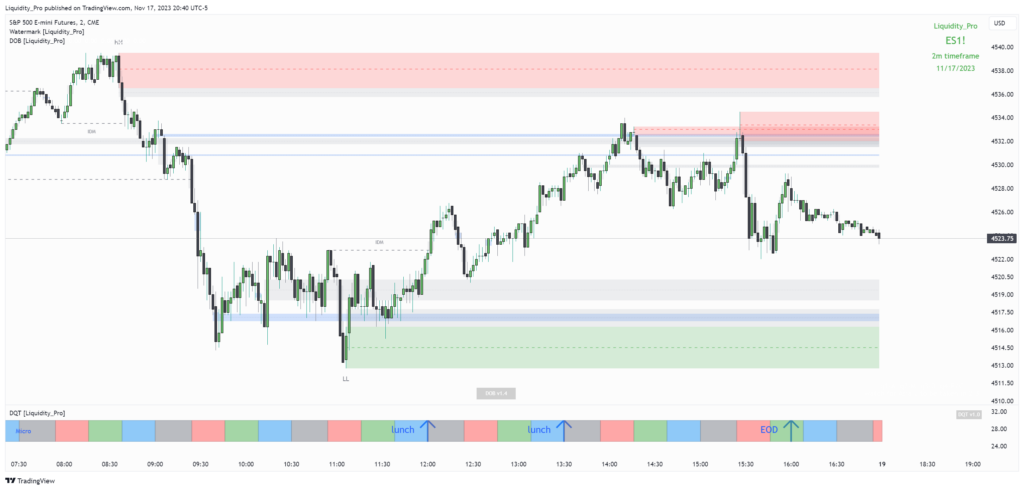
Order blocks with displacement, midlines for FVGs and order blocks, and programmatic market structure.
 Read about DOB →
TradingView indicators · LiquidityPro
Free TradingView indicators based on liquidity, market structure, and time.

Developed by traders, for their own charts.
01 / Price & structure
Order blocks with displacement, midlines for FVGs and order blocks, and programmatic market structure.
Read about DOB →02 / Time & cycles
Explore time-based research through six-hour, 90-minute, and micro quarters on your chart.
The original guide covers quarterly cycles, true opens, settings, and the relationship to ICT’s Power of Three concept.
We trade our own capital and develop free TradingView indicators based on the liquidity concepts taught by ICT and others. Our mission is to simplify our own trading and avoid chart exhaustion -- we aim to reduce screen time and anxiety, and increase our profit. We hope our efforts to achieve this may be useful to others along the way. How did we get here? We are a small team of trading enthusiasts. Prior to LiquidityPro, we spent 24 years building an Internet business serving both businesses and consumers. We started it in 1997, back when the tools were crude and simple, coding HTML by hand. Read more about us.
Displacement Order Blocks (DOB)
This indicator shows order blocks that create displacement and draws deeply from ICT’s body of teachings. DOB draws midlines for FVG, IFVG, and order blocks - if this is new to you, when you back test this indicator, notice how often these lines are precise support and resistance lines for candle bodies. For market structure, the DOB indicator follows TradingHub’s (TH) definitions which filter out inside bars. The TH model is very programmatic allowing clear structure rules that allow us to mark inducements. We day-trade and position-trade with this indicator five days a week and will continue developing it along with others we have not yet published. So please follow us for updates and let us know what new features you would like to see! More about DOB here.
Daye Quarterly Theory (DQT)
This indicator puts the time-based research of @traderdaye on your chart. The fundamental concept is that all units of time can be divided by four into quarters -- just as we look at the year’s corporate reporting cycle of Q1, Q2, Q3, and Q4. Dividing the day by four, into six hour quarters and again into 90 minute quarters and again into 22.5 minute ‘Micro’ quarters we reach the smallest unit shown by this indicator. Apply it to your NQ1! or ES1! charts and you may see remarkable confluence with the ICT macro times... It helps us understand, visualize and predict ICT’s PO3 concept. More about DQT here.